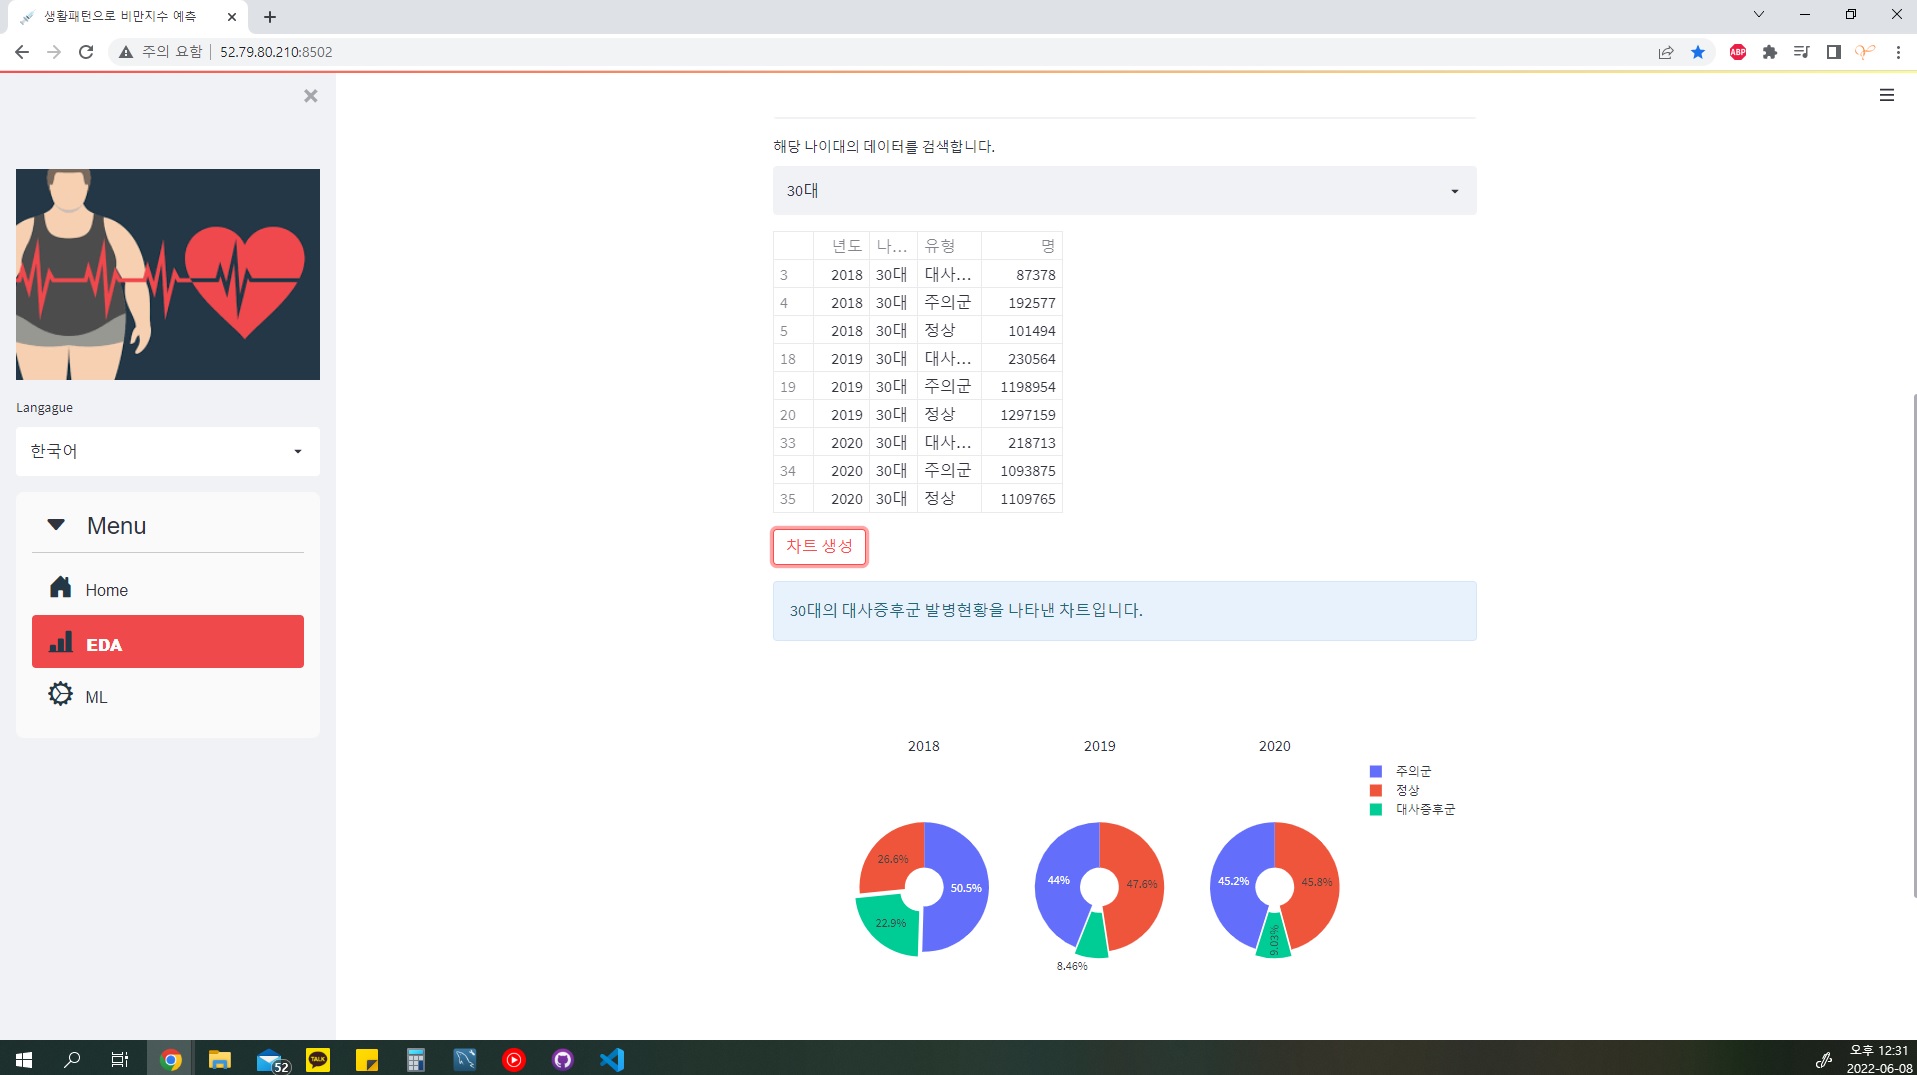
미리보기:

앱 주소: http://www.esyoo.site:8501/
앱 설명:https://github.com/eyoo95/Streamlit_obesity
특이사항:
파이차트를 사용하기 위해 년도별로 데이터프레임을 분리하는 함수 작성
def year_separater(df,year,value,label):
    v18 = df.loc[df[year]== 2018 ,][value].to_list()
    l18 = df.loc[df[year]== 2018 ,][label].to_list()
    v19 = df.loc[df[year]== 2019 ,][value].to_list()
    l19 = df.loc[df[year]== 2019 ,][label].to_list()
    v20 = df.loc[df[year]== 2020 ,][value].to_list()
    l20 = df.loc[df[year]== 2020 ,][label].to_list()
    return [v18,l18,v19,l19,v20,l20]
# 시작년도와 끝년도 파라미터 추가 필요
# 반복문 활용 필요
plotly 사용
elif selected_data == data_topic[3]:
    df_meta_sel = df_meta.loc[df_meta['나이대'].str.contains(get_age),].sort_values(['년도','나이대'],axis=0)
    st.dataframe(df_meta_sel)
    if st.button('차트 생성'):
        st.info('{}의 대사증후군 발병현황을 나타낸 차트입니다.'.format(age_txt))
        meta_vl = year_separater(df_meta_sel,'년도','명','유형')
        fig = make_subplots(1, 3, specs=[[{'type':'domain'}, {'type':'domain'},{'type':'domain'}]],
        subplot_titles=['2018', '2019','2020'])
        fig.add_trace(go.Pie(values = meta_vl[0], labels = meta_vl[1], hole = 0.3,pull=[0.1,0,0]),1,1)
        fig.add_trace(go.Pie(values = meta_vl[2], labels = meta_vl[3], hole = 0.3,pull=[0.1,0,0]),1,2)
        fig.add_trace(go.Pie(values = meta_vl[4], labels = meta_vl[5], hole = 0.3,pull=[0.1,0,0]),1,3)
        st.plotly_chart(fig)
'Streamlit' 카테고리의 다른 글
| [Streamlit] 프로젝트: 기상정보를 통한 교통사고율 예측 앱 (0) | 2022.05.27 |
|---|---|
| [Streamlit] 메뉴 꾸미기 (0) | 2022.05.27 |
| [Streamlit] 로컬에서 만든 앱을 AWS로 배포, 가상환경 구성: joblib (0) | 2022.05.20 |
| [Streamlit] 반응형 차트 만들기 (0) | 2022.05.20 |
| [Streamlit] 차트 그리기 (0) | 2022.05.20 |


댓글