kaggle에서 제공하는 시카고 범죄 데이터를 분석해보자.
- Datasource: 캐글 https://www.kaggle.com/currie32/crimes-in-chicago
다운로드한 csv파일을 변수로 저장한다.
chicago_df_1 = pd.read_csv('Chicago_Crimes_2005_to_2007.csv',error_bad_lines=False,index_col = 0)
chicago_df_2 = pd.read_csv('Chicago_Crimes_2008_to_2011.csv',error_bad_lines=False,index_col = 0)
chicago_df_3 = pd.read_csv('Chicago_Crimes_2012_to_2017.csv',error_bad_lines=False,index_col = 0)
# 변수로 저장할때 이상한 부분은 제외하고 불러오기 위해 error_bad_lines파라미터를 False로 지정한다.
( expected 00 fields, saw 00\n)
# 판다스 버전 1.3.0 이후부터는 on_bad_lines 파라미터를 사용한다고 한다. {‘error’, ‘warn’, ‘skip’}
위의 3개 데이터프레임을 하나로 합친다.
df = pd.concat([chicago_df_1,chicago_df_2,chicago_df_3])
df=

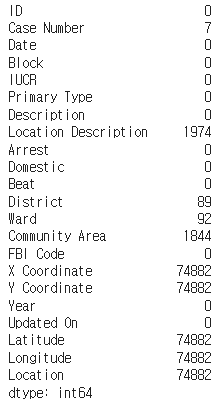
비어있는 데이터가 얼마나 있는지 확인하자
in:
df.isna().sum()out:
실습 1. 다음 컬럼들을 삭제하시오.
'Case Number', 'Case Number', 'IUCR', 'X Coordinate', 'Y Coordinate','Updated On','Year', 'FBI Code', 'Beat','Ward','Community Area', 'Location', 'District', 'Latitude' , 'Longitude'
in:
df.drop(columns=['Case Number', 'Case Number', 'IUCR', 'X Coordinate', 'Y Coordinate','Updated On','Year', 'FBI Code', 'Beat','Ward','Community Area', 'Location', 'District', 'Latitude' , 'Longitude'], inplace=True)out:

실습 2. Date 컬럼을 보니, 날짜 형식으로 되어있다. 이를 파이썬이 이해할 수 있는 날짜로 바꿔서 다시 Date 컬럼에 저장하시오.
df['Date'] = pd.to_datetime(df['Date'],format= '%m/%d/%Y %I:%M:%S %p')# to_datetime 함수로 문자열을 날짜 및 시간 데이터로 바꿔주었다.
# format 파라미터에 어떤형식으로 날짜와 시간이 표시되어있는지 알려주었다.
# 이제 Date컬럼에 있는 데이터는 시간처리할수있게 되었다.
요일마다 어느정도의 범죄가 발생했는지 dt.weekday 를 사용하여 알아보자
in:
df['Weekday'] = df['Date'].dt.weekday
df['Weekday'].value_counts()
out:
4    910373
2    870841
1    865340
3    860425
5    858153
0    843525
6    809110
Name: Weekday, dtype: int64
실습 3. Date 컬럼을 인덱스로 만드시오.
groupby 함수로는 년단위 월단위 시단위 등으로 묶을수 없다고 한다.
따라서 데이트 컬럼을 인덱스로 만들어주면 resample 함수를 사용할수 있게 된다.
resample 함수를 통해 월단위 년단위 등으로 묶어서 처리가 가능해진다.
in:
df.index = df['Date']
df
out:

# Date가 인덱스로 세팅되었다.
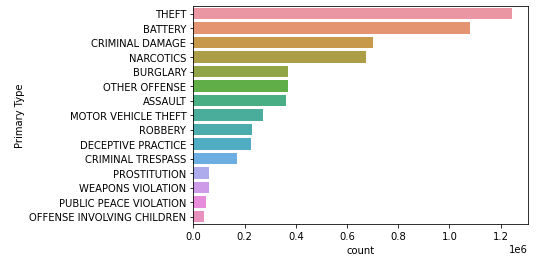
실습 4. 상위 15개의 범죄 유형(Primary Type)의 갯수를, 비주얼라리징 하시오.
in:
top_15 = df['Primary Type'].value_counts().head(15)
sb.countplot(data=df, y = 'Primary Type',order=top_15.index)
plt.show()
out:
실습 5. 데이터를 주기별로 분석해 보자
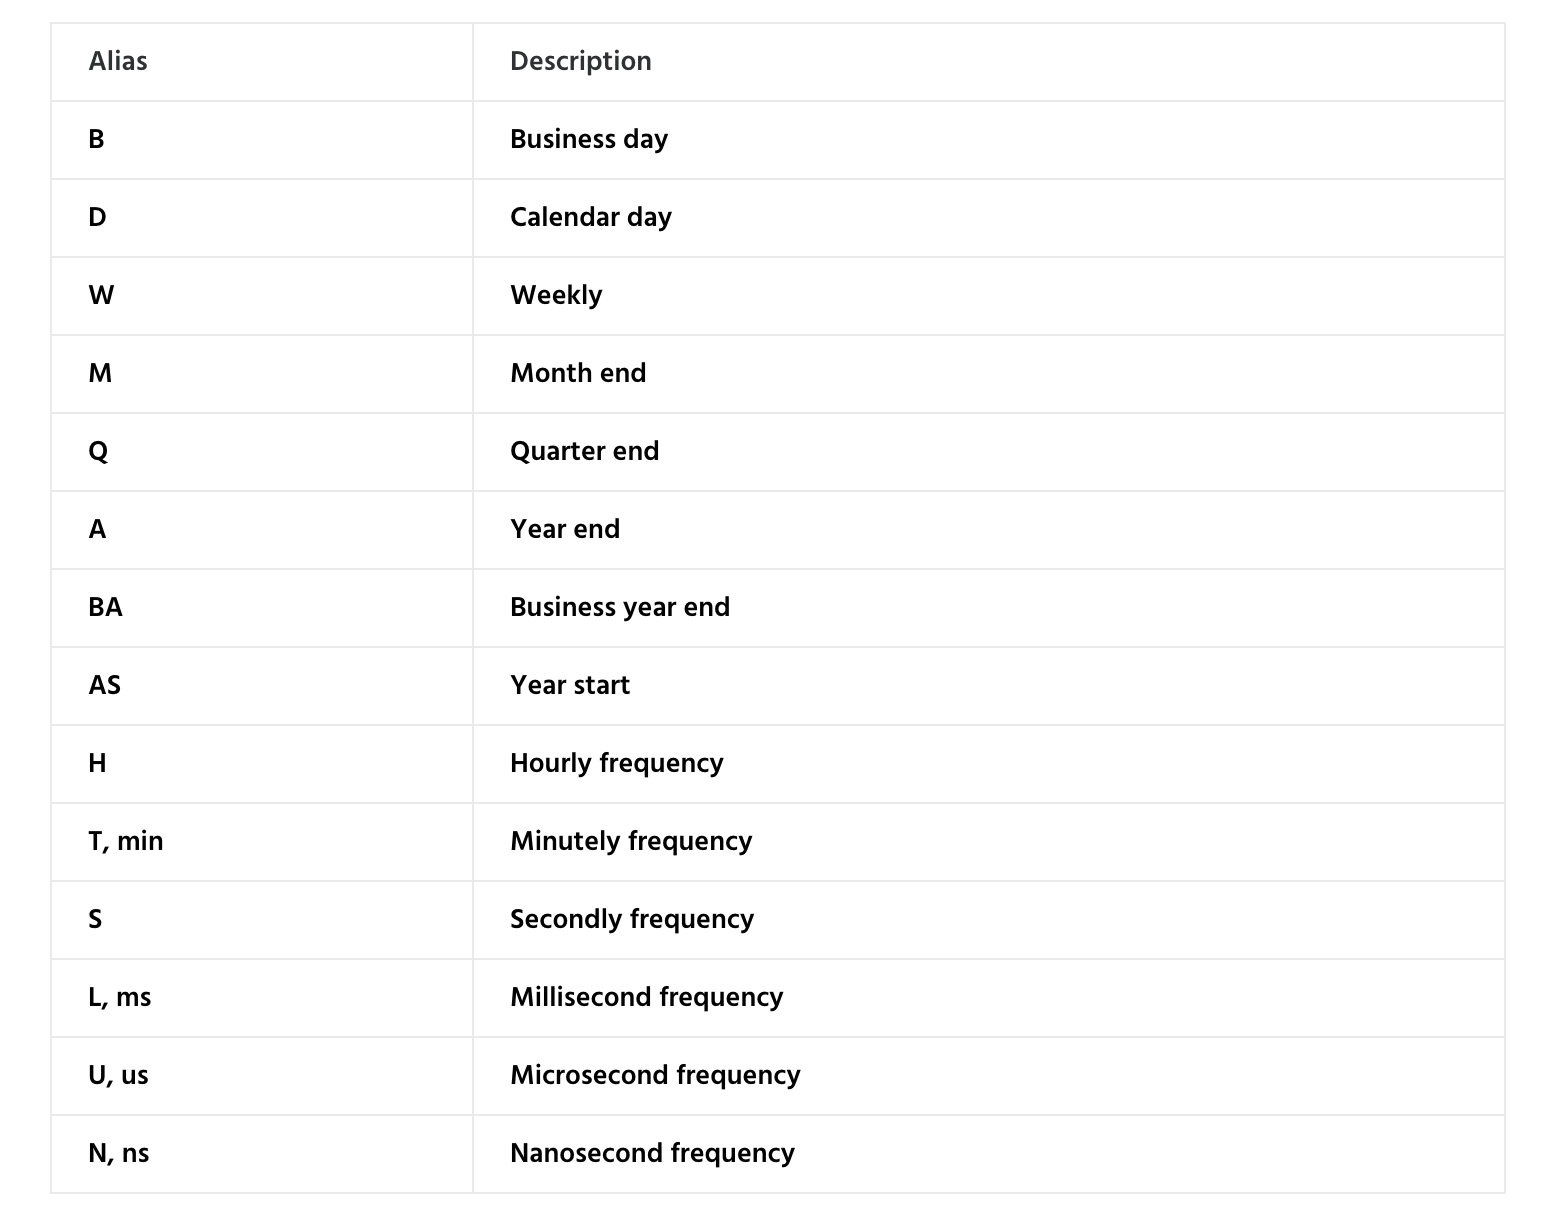
년도로 리샘플한 후, 각 년도별 몇개의 범죄 데이터를 가지고 있는지 확인한다.
in:
df_year = df.resample('Y').size()
df_year
out:
Date
2005-12-31    455811
2006-12-31    794684
2007-12-31    621848
2008-12-31    852053
2009-12-31    783900
2010-12-31    700691
2011-12-31    352066
2012-12-31    335670
2013-12-31    306703
2014-12-31    274527
2015-12-31    262995
2016-12-31    265462
2017-12-31     11357
Freq: A-DEC, dtype: int64
위의 데이터를 plot 으로 시각화 한다. 범죄횟수를 눈으로 확인하자.
in:
plt.plot(df_year)
plt.show()
out:
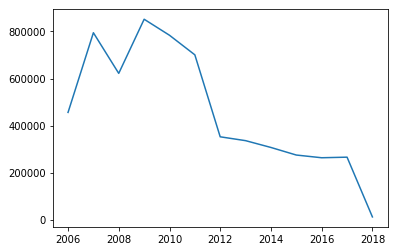
# 2011부터 시카고의 범죄가 급격하게 줄어든것을 볼수있다.
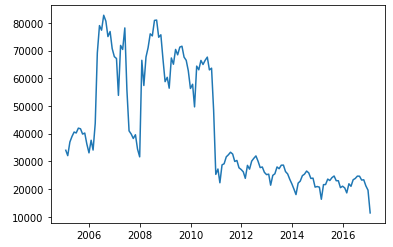
월별 범죄 발생 건수를 확인하자.
in:
df_month = df.resample('M').size()
plt.plot(df_month)
plt.show()
out:
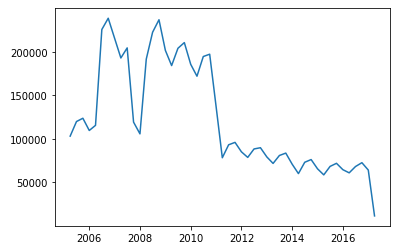
분기별 범죄 건수도 확인하자.
in:
df_quarter = df.resample('Q').size()
plt.plot(df_quarter)
plt.show()
out:
실습 6. 월별로(매달 말일) 주기로 하여 데이터프레임을 만들고, 인덱스를 리셋하시오.
chicago_prophet =  df.resample('M').size()
chicago_prophet = chicago_prophet.reset_index()
실습 7. 프로펫 라이브러리를 사용하여 분석하시오.
먼저 컬럼명을 'ds'와 'y'로 변경해야 한다.
chicago_prophet.columns=['ds','y']
이제 프로펫을 사용하여 데이터를 분석하자
365일 주기로 make_future_dataframe을 설정한다음 프로펫을 실행한다.
prophet = Prophet()
prophet.fit(chicago_prophet)
future = prophet.make_future_dataframe(periods=365)
forecast = prophet.predict(future)
차트로 나타내자
in:
prophet.plot(forecast)out:

in:
prophet.plot_components(forecast)out:
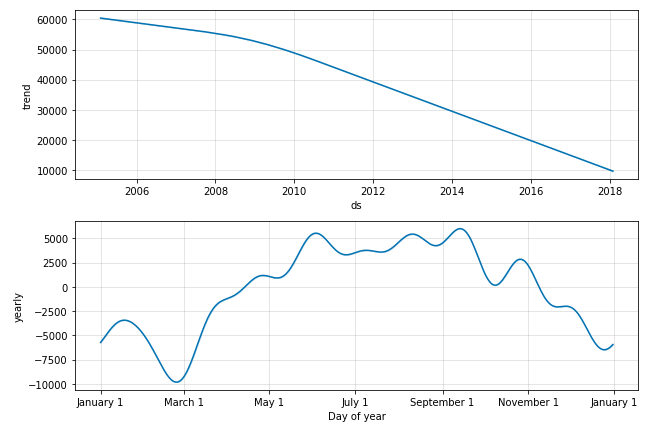
# 시카고의 범죄는 점차적으로 줄어들것으로 예측된다.
'머신러닝' 카테고리의 다른 글
| [머신러닝] 아보카도 가격 예측 실습: Prophet, EDA(Exploratory Data Analysis), make_future_dataframe (0) | 2022.05.10 |
|---|---|
| [머신러닝] Scaler의 inverse_transform, RandomForest (1) | 2022.05.10 |
| [머신러닝] 스팸 분류 실습: CountVectorizer, Data Cleaning, Pipelining, NaiveBayes, Wordcloud (0) | 2022.05.10 |
| [머신러닝] Hierarchical Clustering (0) | 2022.05.10 |
| [머신러닝] K-Means Clustering (0) | 2022.05.09 |


댓글